Category Archives: Floods

Boulder Colorado Flood of September 2013

The city of Boulder, Colorado is flooded after several days of torrential rains. Here’s some useful links if you want to get up to speed on what’s going on.

Turn around, don’t drown. If you’re in the affected area, get authoritative news from local sources (and not this blog).

Scanner

For raw unfiltered news of what is happening, listen to the emergency services scanner for the Boulder area. The Boulder County Sheriff and Fire feed has over 800 listeners as of this writing. You’ll want to listen through headphones, because the feed is a stereo feed with fire/rescue on one channel and police on the other.

A good text counterpart to this is the Boulder Office of Emergency Management twitter feed, which has brief and authoritative updates about the situation. The Boulder OEM web site echoes those updates in more detail.

Local news media

The Daily Camera is Boulder’s daily newspaper, and it has continuous updates on the situation. Their September 12 story is a long list of incidents, warnings, accounts and stories about what’s going on. Twitter: @dailycamera

There’s flooding in the Denver area as well, and the Denver Post is on it. A September 12 Denver Post story notes the extent of the damage:

Heavy rain and massive flooding threatens towns and cities up and down the Front Range into the day Thursday as communities were evacuated, roads closed and emergency shelters set up.
Three people were confirmed dead and at least one missing.
At an afternoon news conference Boulder officials said at least 12 dams in the county had overflowed.The Boulder airport was closed as well as Boulder mountain parks and open space until further notice.

Twitter

As ever, Twitter is on the scene when there’s news. The #boulderflood and #cowx hashtags have been trending, with photos, video, and brief accounts of what’s happening. A #coflood tag covers flooding across Colorado.

Maps

A map has been removed per the owner’s request on 25 October 2013.

The City of Boulder has a road closures map with markers showing where roads are closed or impassible. Officials are recommending that people stay off the roads.

As of Thursday, September 12 in the evening I have not been able to find a good clear map that shows the full extent of affected areas, and emergency operations are still in rescue mode.

Google has a crisis map for the 2013 Boulder Floods. This is a snapshot as of Friday, September 13, in the morning. The dots mark places where roads are closed, and the evacuation area for Longmont is shown as the St Vrain River bisects the town. Look at the current map for the latest details, and know that roads are being opened and closed in response to changing needs.

Screen shot 2013-09-13 at 10.39.12 AM

Cities affected by the flood

This is an incomplete list of towns and villages beyond Boulder that are affected by the flood.

Lyons, Colorado: Photos on Facebook at the Lyons, Colorado page and at Kenneth Wajda’s site I Am Lyons Colorado.

A National Weather Service alert warns of flash flooding hazards in Lyons, Jamestown, Peaceful Valley, Allenspark, Raymond, Meeker Park and Longs Peak.

Another alert warns for flooding in the following locations: Northwestern Arvada, Western Westminster, Boulder, Western Longmont, Southwestern Broomfield, Lafayette, Louisville. Superior, Lyons, Jamestown, Salina, Eldorado Springs, Crisman. Gold Hill, Niwot, Summerville, wallstreet, Rocky Flats. Raymond, sunshine, white Ranch open space and Allenspark.

The Jefferson County Sheriff has emergency information on a Blogspot weblog.

KRDO has a log of Colorado Springs flooding information.

Water levels

The Boulder Creek hydrograph shows current water levels measured in Boulder. As of this writing the creek is in “moderate flood stage” and rising.

Bocc2_hg

History

This flood is being compared to the 1894 Boulder flood. The Boulder History Museum account of that flood reads in part:

As rains continued, adding to spring runoff, Boulder Creek began to rise. The threat of a flood was serious. Overnight, the creek rose out of its banks and rushed through the canyons above Boulder. By daybreak the creek had turned into an angry river, carrying debris from the settlements and bridges it destroyed in the mountains. In Boulder, the creek had begun its destruction as it swept the Sixth and Twelfth Street bridges downstream. The flood submerged railroad tracks, roads and farms, and tore down telephone and telegraph poles, taking Boulder’s means of transportation and communication out of commission.

July 8, 2013 Toronto flooding

The streets of Toronto are full of water as over 100 mm of rain (about 4 inches) has fallen in some areas. Meteorologists are making comparisons with Hurricane Hazel, which flooded the area in 1954.

Some of the best brief accounts are on Twitter, using the various hashtags #TOflood, #floodTO, #TOstorm, #stormTO, and #darkTO.

I listened to CBC Radio 1 Toronto for a while to get a sense for how bad it is. CFTR, 680 News, is an all-news radio channel, here linked via TuneIn. There are more photos at the Globe and Mail, and at the moment there's live TV coverage online on CP24.

Lots of people are without power; there's a power outage map from Toronto Hydro but it appears to be incomplete; the @torontohydro Twitter feed says 300,000 without power as of about 9:00 p.m. ET.

June 27, 2013 flooding in Ann Arbor

Several streets in Ann Arbor have flooded as a result of slow-moving storm cells that passed through the city on the afternoon of Thursday, June 27, 2013. Reports are still filtering in, but here’s what I know about right now.

The City of Ann Arbor is building a “Citizen Storm Corps” volunteer group to assist in stormwater/flooding data collection. Volunteers will visit Large Event Data Gathering locations after significant rain events, record visual observations about the stormwater’s behavior at that location using a LEDG Stormwater/Flooding Reporting Form, and submit the data to the city. If interested in volunteering, e-mail stormmodel@a2gov.org.

US-23 at Warren Road

From the National Weather Service, all caps in original.

STREET FLOODING HAS BEEN REPORTED IN ANN ARBOR FROM AROUND 2 INCHES
WITH THE WARREN STREET UNDERPASS OF US 23 FLOODED & CLOSED. WITH
ADDITIONAL HEAVY RAINFALL EXPECTED FROM STORMS.ANY FLOODING WILL
BE EXACERBATED WITH FLOODING PROBLEM MOST LIKELY SPREADING IN AREAL
COVERAGE AS A LINE OF THUNDERSTORMS DROPS SO. INTO THE AREA.

Depot Street.

Depot between North Main and Fourth has flooded. This is an ambulance route, and at least one ambulance had to turn back because of the high water.


State Street.

South State Street near Yost Arena has flooded. U of Michigan athletes were out pushing stalled cars.

Huron and Washington near the Ann Arbor Railroad

South Fifth near Fingerle Lumber

Behold Lake Fingerle

Hatcher Library basement

The basement of the University of Michigan Hatcher Graduate Library took on some water; a truck from Belfor was there later in the evening.

Hill and South Division

Detroit Street at Beakes>

South Industrial

Just south of Kroger

Hoover and Mary

N. Ashley and Felch

A 55mb .MOV file showing the flooding at that corner; it plays on Macs with Quicktime. From @voxphoto, via the Ann Arbor Chronicle.

South Main between Packard and Madison

Looks like this was taken from inside Hook Logic.

More local coverage: AnnArbor.com.

Related articles

AnnArbor.Crowdmap.com – collaborative analysis of storm impact
March 28, 2013 North Quad flood

June 2013 Calgary, Alberta floods (#yycflood, #abflood)

Flooding of the Bow and Elbow Rivers inundated downtown Calgary, Alberta on June 21, 2013. Flooding and flash flooding has affected large parts of southern Alberta, due in part to a slow-moving storm front that is dumping a lot of rain on the area, up to 7.5 inches in 2.5 days. Three people have died from the flooding.

If you’re in Calgary, Alberta reading this, you should know that it’s likely to be out of date and incomplete. Check with local authorities and local news services for the most current information.

News reports: be patient, prepare for power outages, limit travel, and conserve water.

The below video is published on Youtube by the Calgary Police, showing about 60 minutes of helicopter footage of the flooding.

Map from Google Crisis Response, snapshot on June 21, 2013.

Google-crisis-response-calgary-alberta-yyzflood

News sources:

Social media:

Maps:

Official sources:


Related articles

Calgary flood: Alberta residents describe what they’re seeing – CBC.ca
Alberta floods force thousands from homes
Map/Video: 100,000 to be evacuated from Calgary floods; downtown emptied
Lockdown of Calgary police makes Twitter a massive #fail in emergency communications
LIVE: Flood waters lay siege to Calgary and southern Alberta
#yycflood: Scaffolding section gives way on new bridge under construction at the Bow River

Wet West Michigan: maps of flooding, April 2013

This map from MLive shows roads closed due to flooding in Western Michigan. (Turn around, don't drown). Click through for the interactive version.

Screen shot 2013-04-21 at 3.23.18 PM
A similar map from NOAA shows flood gauge readings across the area.

Screen shot 2013-04-21 at 3.26.59 PM
The purple gauge in this above map is Grand Rapids at Comstock Park, which is showing flooding at almost 6 feet above flood stage.

Screen shot 2013-04-21 at 3.29.56 PM
The historical big flood in Grand Rapids is from 1904; this collection rephotographs scenes from that flood in 2004.

March 28, 2013 North Quad flood

North Quad at the U of Michigan had a flood today, causing classes to be cancelled and students to be evacuated from their rooms. There is no estimate of the damage at this time, but it’s extensive.

The University of Michigan School of Information has a flood information page with reschedule and relocate information for classes and talks.

All media inquires about the flooding should be directed to Kelly Cunningham in the UM Public Affairs Office: kecunham@umich.edu, 734-936-5190.


Photo by Heidi Skrzypek, UMSI staff

From the Michigan Daily “Flooding forces cancellation of classes in North Quad“:

According to Ken Campbell, North Quad’s maintenance mechanic, a broken joint pipe on the building’s fire suppression system was responsible for the flooding. The break occurred in the East Stairwell on the fourth floor of the building, he said. When the pipe lost pressure, the system automatically turned the water pump on to add pressure, exacerbating the flow from the three-inch pipe.

Campbell estimated that “thousands and thousands” of gallons poured from the pipe before it was turned off 20 minutes later.

From the AnnArbor.com: Nearly 100 students displaced by flooding at University of Michigan’s North Quad

Jeff MacKie-Mason, dean of the U-M School of Information, sent an email to the school community stating that the The Ehrlicher Room in North Quad sustained major damage in the flooding.

“We will not be able to use it for some time, perhaps several months (the ceilings may need to be replaced, walls may need repair, the carpet and our extensive electronics equipment may need replacement),” MacKie-Mason wrote in the email.

From the Ann Arbor Chronicle: nothing.

From the Ann Arbor Journal: nothing.

2 of of 4 isn’t bad.


Related articles

North Quad Community Open House, Thursday March 31, 2011, 3p-6p
And This is Why Ann Arbor Is Obsessed With Itself
Living With Floods: How you can minimize the damage

Hurricane Isaac flood maps and flooding predictions

Hurricane Isaac brought with it high winds and a substantial amount of rain, and both of those combined has led to a lot of flooding. Here are some maps I've collected while the storm is still underway. You should know that for each of them I'll also give a link to the underlying mapping source so that you can get current information.

If you are in the affected area and need details about flooded roads or the risk of dams or levees bursting or anything else, do not trust this weblog for current information; seek out official and up to date sources.

Most of the maps are dated August 30, 2012, unless otherwise noted.

Rainfall

A good source for maps of observed precipitation is water.weather.gov, specifically the AHPS (Advanced Hydrometeorological Prediction Service). Here's a 7 day observed rainfall for Louisiana from that service, showing some areas with upwards of 20 inches of observed rainfall.

Ahps-louisiana-7-day-precipitation
Predicted rainfall

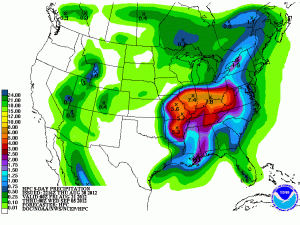
A good source for rainfall predictions running out to the next 5 days (120 hours) is the Quantitative Precipitation Forecast (QPF). These models are updated several times a day and give rainfall estimates over the entire country. (Your rainfall will differ.) This is the run from Thursday, August 30, 2012, showing a predicted 5 day course for the remnants of Isaac to dump rain up the Mississippi and Ohio River valleys.

P120i00Predicted flooding

The National Weather Serivce Watch, Warning, Advisory Display shows this map with areas in pale green with warnings of potential floods, darker green (Arkansas) with current flood conditions, and parts of Louisiana and Mississippi with flash flood warnings. The accompanying text for some forecasts note that because of the dry and drought conditions the ground will be hard, and thus less able to absorb moisture leading to heavy runoff and flooding.

Picture 13

River gauges, current

Many rivers have flood gauges which measure and report current flood status. This is a map from water.weather.gov's River Observations page showing the whole nation, with flooding marked in color. You can zoom in to individual observations as well.

Ahps-river-observations
Here's a zoom of the New Orleans area for the same data. Please note that the gauges are only on rivers, and will not show flash flood areas, levee breaches, or other places where water is not usually found.

Picture 11
Satellite imagery

I'll be on the lookout for satellite photos that show flooding; those usually don't appear until after the storm has cleared, because any imagery sensitive to water will pick up the clouds first.  Here's a NASA Aqua/MODIS image, pulled from their Rapid Response Imagery datasets.

Picture 12

September 2011 flooding on the Susquehanna River basin after Tropical Storm Lee

The remnants of Tropical Storm Lee have made their way slowly from the Gulf of Mexico to the northeastern United States, bringing a storm with a slow-moving heavy rain. There is widespread flooding in the Susquehanna River basin and flash floods across the area. The Weather Underground's Jeff Masters has commentary on the storm from the morning of September 8, 2011, saying

An extreme rainfall event unprecedented in recorded history has hit the Binghamton, New York area, where 7.49" fell yesterday. This is the second year in a row Binghamton has recorded a 1-in-100 year rain event; their previous all-time record was set last September, when 4.68" fell on Sep 30 – Oct. 1, 2010. Records go back to 1890 in the city. The skies have now cleared in Binghamton, with this morning's rain bringing the city's total rainfall for the 40-hour event to 9.02". However, another large region of rain lies just to the south in Pennsylvania, and all of the rivers in the surrounding region are in major or record flood. The Susquehanna River at Binghamton is at 25', its highest level since records began in 1847, and is expected to overtop the flood walls protecting the city this afternoon. In Hershey, Pennsylvania, Swatara Creek is 18' over flood stage, and more than 8' above its record flood crest. Widespread flash flooding is occurring across the entire area, and over 10,000 people have been evacuated from their homes.

For current information, tune in to local news. Among the sources I have found that are broadcasting emergency flood coverage are WNEP TV-16 Scranton, the Times Leader in Wilkes-Barre, the Times Tribune, and WBNG-TV 12 Binghamton.

Emergency services channels can be tuned in via Radio Reference for Binghamton, Broome, Tioga, and Susquehanna CountiesLycoming County Public SafetyBradford County FireSchoharie County Public Safety; and other systems.

Here are some maps.

The Middle Atlantic River Forecast Center is a good first place to look for current information. This map from Wednesday, September 7, 2011 shows the flooding outlook for the area.

Fop
From the same source, point by point forecast river conditions:

Fcst

This rain map, which Jeremy Denlinger pulled from the National Weather Service, shows a 72 hour rainfall total for the area.

392650910
Flooding in the Wilkes-Barre, PA area lead to mandatory evacuation of low-lying areas of the Wyoming Valley, according to a story in the Times-Leader which ran this map of affected areas:

Wilkes-barre-evacuation

Forecasters are comparing the impact of this storm to the 1972 Hurricane Agnes. The National Weather Service has a detailed meteorological account of the flooding from that storm.

2011 Vermont flood maps after Irene

Vermont was hard hit by Irene. There are lots of photos and videos out there showing some of the devastation and flooding; here are maps that give some sense for the area involved. 

Vermont Flooding 2011 on Facebook is a good community resource, as is Mad River Valley Hurricane Irene. For volunteer coordination, see the VTResponse weblog.

Detailed city maps showing flooded areas are not yet available. FEMA maps show the most vulnerable areas, and are available for BurlingtonMontpelier, Waitsfield, and other cities.

A collaborative map of the incident is VTIrene, hosted on Crowdmap. Another VTIrene collection by Dan Dowling on Scoop.IT has an aggregation of news, video, and twitter accounts.

Compare with the 1927 flood; the Landscape Change Program at the University of Vermont has aerial photography of that event. See the National Weather Service's Flood of 1927 information.

River information from the Northeast River Forecast Center (RFC).

Vermont-river-conditions

Vermont road information from VTrans. Please check current road conditions; this is not a current road map. An interactive Google map of Vermont highway conditions has more precision.

VT_statewide

Vermont New Road Closures is a crowd-sourced map, which includes information about local roads not otherwise noted on the official map. This is a snapshot from August 31, 2011.

Vermont-new-road-closures

Google.org's Vermont Flooding 2011 map has a series of map overlays; this one depicts bridges out, roads closed, and towns that are isolated. Much of the data can be downloaded in KML formats, and the interactive version of this lets you zoom in; this snapshot is observed August 31, 2011.

Google-crisis-response-vermont-2011

One day and seven day precipitation totals, from NERFC and AHPS.

Northeast-one-day-rainfall Northeast-seven-day-rainfall

Huron River: May 25, 2011 flooding

The river is high. Will it flood? That's a very good question to ask in the morning before a storm; and the answer today turned out to be yes. Roads were inundated, Lake Barracuda emerged from its stormwater geyser, Depot Street filled with water, Mullholland Creek popped a manhole cover, and S. Main Street near Michigan Stadium filled. West Park's new water features get a workout.

Basements have taken on water, and the full extent of storm damage is unknown yet until we get the May 26 predicted rains.

Media coverage: Detroit News, noting that this is the 6th worst flood to date; AnnArbor.com, collecting more flood photos, including those of Lake Fingerle.  

A few photos, with photo credits:

Lake Barracuda, captured at Depot Street by photographer Chris Dzombak. Photo used with permission, all rights reserved. The lake is named after Barracuda Networks, which occupies the new stilt-built stay-dry construction at 201 Depot St. More photos from Chris in the Flickr set Flooding at Depot/4th.

Download-2
The river seen from above, taken by Kai Petainen, used with permission. His set Huron River Flood has photos and some short video taken from Island Park downstream to the Arboretum.  Kai writes for Forbes with the weblog Sisu Investor.

5759470639_6ede3551c5
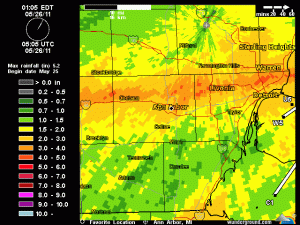
Map of total rainfall storm to date for this storm, from the Weather Underground, as of 1:05 a.m. Thursday. Pick "total precipitation" from the radar screen, or pop out the "1 hr precipitation" from the side in the Weather Underground Classic user interface and animate to watch storms come in.

WUNIDS_map-1

If you're looking for data, you'll find the specific current and recent historical information from these sources.

The USGS  Water Data Discovery page describes the National Water Information System which has reat time, predictive, and historical data for use.

USGS National Water Information System real-time water data for gauges in the area is measured every 15 minutes and reported with 60-90 minutes delay. Look at the gauges for the Huron River at Ann Arbor, and you'll see a graph showing current levels. It's also possible to go back and get the data as data going back as far as 120 days, and to retrieve prior years data on a daily basis. 

There is also a gauge on Allen Creek which has collected data from some storms, but which is not in the National Water Information System and not always online. Allen Creek empties into the Huron River just downstream of Argo Dam, and at peak flow it can dump at least 1500 cubic feet per second into the river. I have seen data from one storm, and it looks like this can turn into 600 cubic feet per second at the next gauge, though that's only one data point.

You can look yourself at the tabular data for the river rating of the Huron River at Wall Street, which shows a level by level matching of flow vs water height. If the river is very low (300 cfs), then a sudden burst of 600 cfs will raise the level of the river by about a foot, and a burst of 1500 cfs will raise the level of the river by about two feet.

River forecasts come out routinely between 9:00 a.m. and 11:00 a.m. and if needed a second forecast goes out between 9:00 p.m. and 11:00 p.m., according to National Weather Service meteorologist Danny Costello

For more media information about products provided by the NWS, here's a slide deck I found on the Grand Rapids NOAA site as a media briefing. It explains in one of the slides a key aspect of predictions: the weather service changes from "watch" to "warning" when a forecast probability goes up to 80% likelihood of the event occurring.

Noaa 2011 hydro_media_seminar

More river watching tomorrow.